Within Power BI reports, most charts and tables have the option to export data so you can examine it in Microsoft Excel or another tool. This article will show you how to do it.

As of February 2020, you can export data from a Power BI report in two formats:
- Excel file (*.xlsx) - limited to 150,000 rows
- Comma-separated values file (*.csv) - limited to 30,000 rows
The Excel option allows you to export both the summarized data and the underlying data from a given visual. The CSV option will only allow you to export the summarized data.
Exporting the summarized data gives you an aggregated view of the data you have exported. Exporting the underlying data will export each individual row of data that makes up a given visual. However, exporting the underlying data may take a few minutes to complete if there area many rows and columns in your chosen dataset, or it may fail entirely if the export exceeds the row limit.
To export data from a Power BI visual, simply select the visual by left-clicking on it, or hover over it, until you see a small ellipsis icon (...) appear in the upper-right or lower-right corner. This is the "more options" menu. Click it to see the options, then select "Export data."

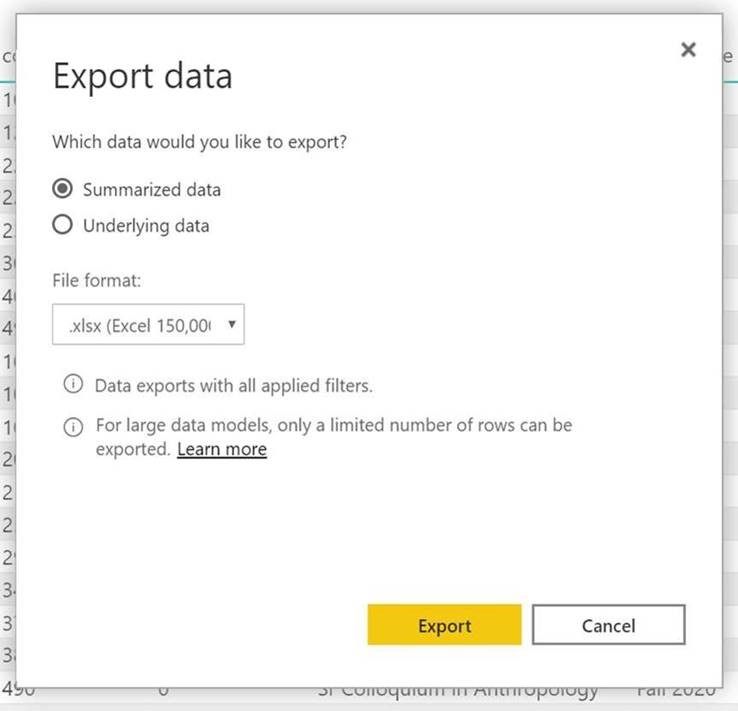
A window will appear that prompts you to choose between exporting the summarized or underlying data, as well as choosing your file format. Most users can probably just use the default options of "Summarized data - Excel."
Once you've made your selections, click the "Export" button. Power BI will then prompt you to choose your download location on your computer. Note once again that exporting the underlying data can take a while. The screen may appear to be doing nothing for several moments while the report queries the underlying data and packages it into the Excel file.


Comments
0 comments
Please sign in to leave a comment.